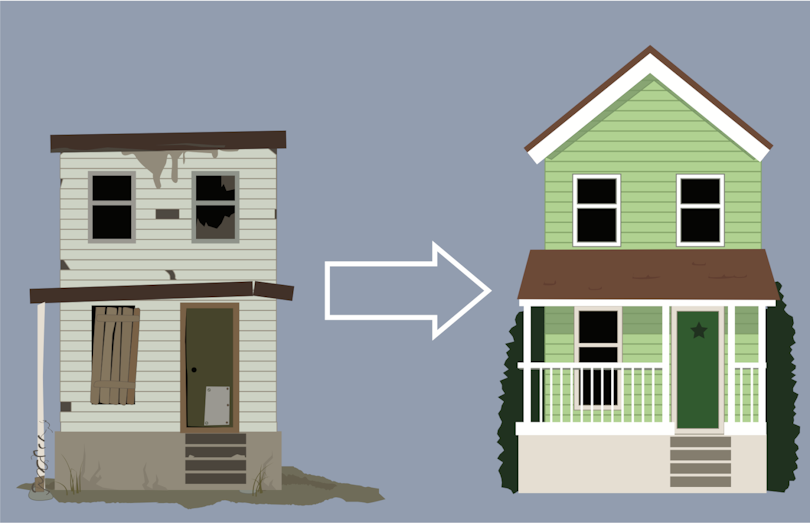
The fix-and-flip real estate strategy—buying undervalued properties, renovating them, and selling for profit—can yield significant returns when executed with precision. Central to success in this venture is the ability to evaluate properties accurately and efficiently. The Multiple Listing Service (MLS) provides a rich data source for investors seeking to assess the viability of a potential flip. By learning how to analyze and leverage MLS data effectively, investors can make informed decisions and minimize financial risks.
What Is MLS Data?
The MLS is a database used by real estate agents and brokers to share information about properties for sale. It contains detailed listings, including:
-
Listing and sale prices
-
Days on market (DOM)
-
Property features (e.g., square footage, number of bedrooms/bathrooms)
-
Photos and virtual tours
-
Property history (price changes, prior listings, etc.)
-
Neighborhood and school data
-
Agent comments and disclosures
This comprehensive data can be a powerful tool for real estate investors when evaluating a potential fix-and-flip deal.
Step-by-Step Guide to Using MLS Data for Fix-and-Flip Evaluation
Identify Target Neighborhoods
Start by filtering MLS data to focus on neighborhoods with strong investment potential. Key indicators include:
-
Rising home values over the past 12–24 months
-
Quick turnover rates (low DOM)
-
Presence of recent successful flips
-
Proximity to amenities, schools, or new developments
Look for areas with consistent buyer demand but still have undervalued homes that need cosmetic or structural improvements.
Analyze Comparable Sales (Comps)
“Comps” are recently sold properties that are similar to your target property in size, condition, and location. When reviewing comps:
-
Focus on homes sold within the last 3–6 months
-
Stay within a 0.5 to 1-mile radius (unless rural)
-
Match bed/bath count and square footage (within ~10–20%)
-
Prioritize renovated properties (they reflect your potential after-repair value, or ARV)
The average price per square foot from these comps can help estimate the ARV of the property you’re evaluating.
Assess Days on Market and Price Trends
The DOM metric provides insight into the local market’s health. Properties that sell quickly suggest high demand, which is ideal for flippers.
Also review:
-
Trends in listing vs. final sale prices
-
Frequency of price reductions
-
Seasonal market shifts
A hot market reduces holding time, which cuts carrying costs and increases profit potential.
Evaluate the Property’s Condition
MLS photos, agent remarks, and previous listings can reveal much about a property’s current condition. Look for:
-
Outdated kitchens/bathrooms
-
Signs of deferred maintenance (e.g., roof issues, poor landscaping)
-
Structural flaws or water damage
-
Layout inefficiencies
Properties with cosmetic issues but sound structure are typically the best fix-and-flip candidates.
Estimate Renovation Costs
While the MLS doesn’t provide direct cost estimates, it helps scope out what’s needed. Based on your evaluation and contractor input, break down renovation categories:
-
Light ($15–$25/sq ft): Paint, flooring, fixtures
-
Moderate ($25–$50/sq ft): Kitchen/bath remodels, roof, windows
-
Heavy ($50–$100+/sq ft): Major systems, layout changes, foundation
Compare the renovation budget with the potential ARV to calculate your margin.
Calculate the 70% Rule
A popular rule of thumb in flipping is the 70% rule, which suggests:
Maximum Purchase Price = (ARV × 70%) – Estimated Repair Costs
This buffer covers purchase, rehab, holding, and resale costs while leaving room for profit. Use MLS-derived ARVs and your renovation estimate to plug into this formula.
Track Active and Pending Listings
Active listings give a sense of current competition. Are there many similar homes on the market? Are they sitting or selling quickly?
Pending listings show buyer interest and can help you forecast near-future sale prices.
These indicators inform whether your flip will stand out or be drowned in a crowded market.
Pro Tips for Leveraging MLS More Effectively
-
Work with an investor-friendly real estate agent who can set up automated alerts and provide access to non-public data.
-
Use MLS tools (like CMA reports, heatmaps, and pricing histories) to visualize trends.
-
Watch for relisted properties, which may indicate hidden problems or overpricing.
Limitations of MLS Data
While the MLS is invaluable, it has some limitations:
-
It may not include off-market or distressed properties (foreclosures, auctions)
-
Renovation quality isn’t always evident from photos or descriptions
-
Some data (e.g., seller motivations, lien history) isn’t disclosed
For a more complete picture, supplement MLS research with on-site inspections, contractor estimates, and public records.
Conclusion
Mastering MLS data is a cornerstone of successful fix-and-flip investing. From estimating ARV to identifying profitable neighborhoods, the MLS provides critical insights that guide purchase and renovation decisions. By combining analytical rigor with market intuition, investors can transform data into profitable flips.
As the real estate market evolves, those who leverage tools like the MLS with discipline and strategy will be best positioned to capitalize on opportunities—and avoid costly mistakes.
Frequently Asked Questions
What is the significance of “comparable sales” (comps) in evaluating a fix-and-flip deal, and how are they selected from MLS data?
Comparable sales are essential because they provide a realistic estimate of a property’s After Repair Value (ARV)—the price the property could sell for post-renovation. Accurately estimating ARV is key to knowing how much you can afford to pay for the property and how much profit is possible after renovations.
To select comps from the MLS:
-
Choose properties sold within the last 3 to 6 months.
-
Stay within a half-mile radius of the subject property (or 1 mile in low-density areas).
-
Match property characteristics: square footage within ±15%, same bed/bath count, similar lot size.
-
Focus on homes in similar condition or those recently renovated, as these reflect the potential resale value of your project.
MLS allows sorting and filtering these results and often shows price per square foot, which helps in adjusting values for differences between the subject and comps.
How can Days on Market (DOM) in MLS data help you evaluate a fix-and-flip opportunity?
Days on Market (DOM) indicates how long a listing took to go under contract or sell. For fix-and-flip investors, this metric helps evaluate market demand in the neighborhood. A low average DOM (e.g., under 30 days) typically signals high demand, meaning a flipped home is likely to sell quickly—reducing holding costs and financial risk.
Conversely, high DOM values may point to sluggish demand, overpricing, or market saturation. In such areas, flips may take longer to sell, increasing costs like property taxes, insurance, utilities, and loan interest.
By checking DOM for comps and current active listings in the MLS, investors can gauge whether the local market is favorable for a quick resale.
What types of renovation needs can be identified through MLS listings, and how reliable is this information?
MLS listings often include photos, descriptions, and agent remarks that give clues about the property’s condition. You can identify:
-
Cosmetic issues: outdated kitchens, worn carpet, faded paint.
-
Signs of neglect: damaged roof, poor landscaping, broken fixtures.
-
Layout inefficiencies: odd room shapes or inaccessible bathrooms.
-
Clues to major issues: mention of “sold as-is,” “investor special,” or lack of interior photos.
However, the MLS isn’t a substitute for an inspection. Photos can be outdated or flattering. Some major issues—like plumbing, foundation, or electrical problems—are often not visible or disclosed. Therefore, MLS data is best used for preliminary evaluation, followed by a walk-through and professional inspection to confirm renovation needs and costs.
What role do active and pending listings in MLS play in evaluating a property’s resale potential?
Active and pending listings provide real-time market data. They show current competition, buyer activity, and price trends in the area.
-
Active listings help you assess market saturation. A large number of unsold similar homes may mean strong competition and slower sales.
-
Pending listings reveal how many homes are under contract, indicating buyer demand and price points that are generating interest.
Together, these metrics show whether your future flipped property will be competitive and how quickly it may sell. If similar renovated homes are pending within 10–20 days, it’s a good sign your flip could sell quickly at or near asking price.


